Welcome to our Embeddables.
The Collective Intelligence Dashboard (CIDashboard) is a place in which analytics on conversational and social dynamics can be made visible and fed back to the community for further awareness and reflection on the state and outcomes of a public debate. This site allows you to choose individual visualisations or compilations of visualisations as a custom dashboard that can be embedded as an iframe or linked to as a full page from your platform. CIDashboard uses your data passed to us in the Catalyst Interchange Format (CIF).
We currently have three types of embeddables:
Large Visualisations


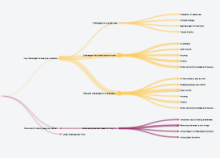
Mini Visualisations
Alerts
Choose the language for the embeddable:
Refresh every:
 |
 |
 |
 |
 |
 |
The above field is where you paste a url which must return jsonld
formatted to the Catalyst Interchange Format (CIF).
The system will then use this data to draw the visualisations you select.
Each visualisation has dependencies on the presence of certain data elements in the data you supply us.
Please check your data matches the dependencies for the visualisation you select.
Note: We cache your data temporarily to speed up displays and we therefore request
that you also indicate how often we should refresh our cached data from your given url in the next field.
The default is 60 seconds.
If you wish to override the terminology used in the visualisations for the node and link type names to make it more specific to your platform and users, you can supply a url that expresses their replacement names. You can find specific details on the structure of this json file on the Help page.
If you wish to display user names, descriptions or homepage
links in any of the visualisations you select that require them,
but you do not wish that data to be cached or stored on a server,
you can optionally supply a separate url to get that data.
The user url is only called and displayed by the browser and
never the server, so that user data is not stored on any server.
The user data must be supplied in CIF format containing CIF Agent
objects with ids that match those supplied in the visualisation data given in the url above.
The user url must be https and the server processing the user url must be able to pick up
the 'callback' parameter we add to the their user url and wrap the reply json in the callback
function we name. Here is an example of a user url with a callback function appended:
https://debatehubdev.kmi.open.ac.uk/api/unobfuscatedusers/?id=1722128760457755001427202440&callback=processCIFUserDataMore help can be found on the User data and Privacy help page

Conversation Nesting
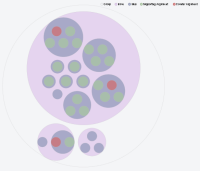
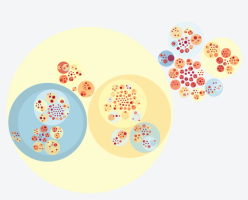
This visualisation shows a Conversation nested inside circles. The colours denote the node types.
Dependencies:
This requires nodes and connections or interconnected posts.
EmbedPage|PreviewDemo
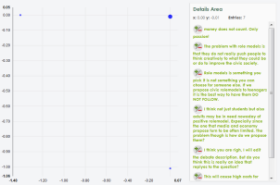
Attention Map
This visualisation shows a Conversation nested inside circles with colors denoting attention distribution across the contributions.
Dependencies:
This requires node and connection data.
EmbedPage|PreviewDemo
Conversation Sunburst Network by Branch
This visualisation display a network graph of the connected nodes in the Conversation as a layered sunburst coloured by branch of the Conversation.
Dependencies:
This requires nodes and connections or interconnected posts.
EmbedPage|PreviewDemo
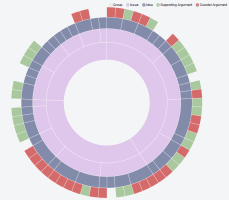
Conversation Sunburst Network by Type
This visualisation display a network graph of the connected nodes in the Conversation as a layered sunburst coloured by node type.
Dependencies:
This requires nodes and connections or interconnected posts.
EmbedPage|PreviewDemo
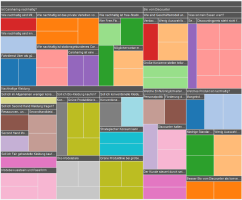
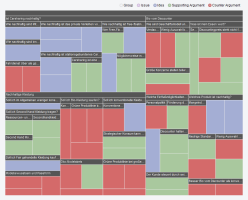
Conversation Treemap
This visualisation displays a treemap of the Conversation. The colours of the squares change to represent sibling groupings. This version of the treemap is good for shallower trees.
Dependencies:
This requires nodes and connections or interconnected posts.
EmbedPage|PreviewDemo
Conversation Treemap By Type
This visualisation displays a treemap of the Conversation. The colours of the squares change to represent node types.. This version of the treemap is good for shallower trees.
Dependencies:
This requires nodes and connections or interconnected posts.
EmbedPage|PreviewDemo
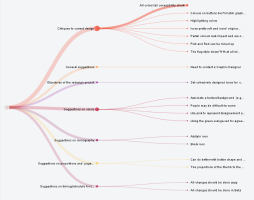
Collapsible Tree
This visualisation displays a tree of the Conversation. The node circle and link sizes are determined by the number of children below a given node.
Dependencies:
This requires nodes and connections or interconnected posts.
EmbedPage|PreviewDemo
Collapsible Tree by Posts
This visualisation displays a tree of the Conversation. The node and link sizes are determined by the number of posts below a given node.
Dependencies:
This requires nodes and connections and posts associated with nodes.
EmbedPage|PreviewDemo
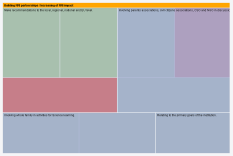
Conversation Treemap - Top down
This visualisation displays a treemap of the Conversation. The first two levels of the tree are exposed initially and then you drill down by clicking the labelled boxes. This version of the treemap is good for deeper trees.
Dependencies:
This requires nodes and connections or interconnected posts.
EmbedPage|PreviewDemo
Conversation Treemap - Top down By Type
This visualisation displays a treemap of the Conversation. The first two levels of the tree are exposed initially and then you drill down by clicking the labelled boxes. The box colour indicate the node type. This version of the treemap is good for deeper trees.
Dependencies:
This requires nodes and connections or interconnected posts.
EmbedPage|PreviewDemo

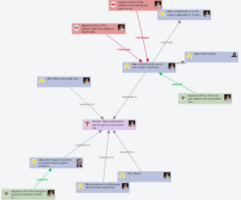
Conversation Network
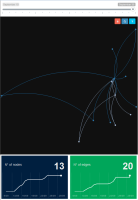
This visualisation display a network graph of the connected posts in the Conversation
Dependencies:
This requires nodes and connections or interconnected posts.
EmbedPage|PreviewDemo
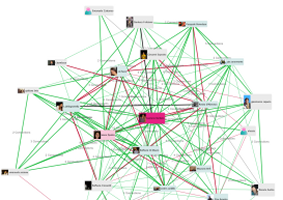
Social Network
This visualisation display a social graph based on a given network graph.
Dependencies:
This requires nodes, connections and node authors or interconnectde posts with authors.
EmbedPage|PreviewDemo
Community Interest Network
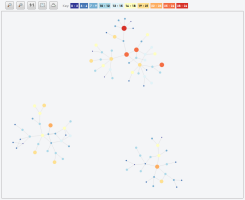
This visualisation display a network graph of the connected nodes in the Conversation showing the community interest in that node by ball size and colour changes.
Dependencies:
This minimally requires user, node and connection data.
EmbedPage|PreviewDemo
Sub-Communities Network
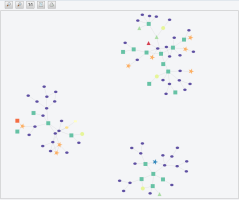
This visualisation display a network graph of the connected nodes in the Conversation. It shows sub-community clustering within the Conversation where the shapes representing the nodes change shape and colour depending on their sub-community.
Dependencies:
This minimally requires user, node and connection data.
EmbedPage|PreviewDemo
Edgesense Social Network
This visualisation shows a social network based on the conversation data supplied.
Dependencies:
This requires user, node, connection data.
EmbedPage|PreviewDemo

User Activity Analysis
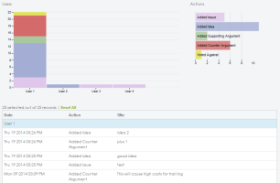
This visualisation shows creation and voting activity by participant.
Dependencies:
This requires nodes and user data with creation and/or voting activity data.
EmbedPage|PreviewDemo
Activity Analysis
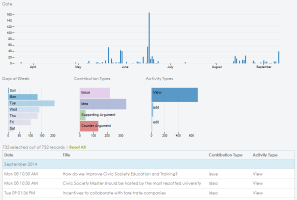
This visualisation shows the activity of a Conversation over time.
Dependencies:
This requires activity data.
EmbedPage|PreviewDemo
Quick Overview
This visualisations provides an overview of important aspects of a Conversation.
Dependencies:
This requires nodes with creation dates and history data
EmbedPage|PreviewDemo
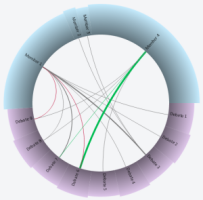
People & Issue Ring
This visualisation show people and issues, letting you explore who added what kinds if items to which issues.
Dependencies:
This requires IBIS data; Issues, Positions, with supporting and counter Arguments which must all include node authors
EmbedPage|PreviewDemo
Contribution Stream
This visualisations shows item creation over time for the various item types.
Dependencies:
This requires nodes or posts with creation dates
EmbedPage|PreviewDemo
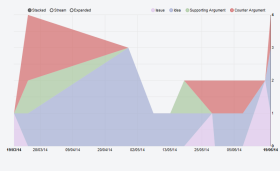
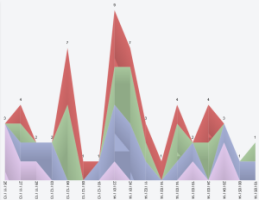
Contribution River
This visualisations shows item creation over time for the various item types.
Dependencies:
This requires nodes or posts with creation dates
EmbedPage|PreviewDemo
Activity Bias
This visualisation clusters contributions based on similar activity patterns.
Dependencies:
This requires voting data.
EmbedPage|PreviewDemo
Rating Bias
This visualisation clusters contributions based on similar voting patterns.
Dependencies:
This requires history data.
EmbedPage|PreviewDemo
If you wish to embed a whole dashboard of visualisations rather than individual ones, you can use can organise your dashboard embeddable here.
NOTE: The CIF data you provde us in the visualisatoin data url above is used to draw all the dashboard visualisations you select, therefore it must contain all the dependent data required by each selected visualisation.
Dashboard (Once selected, visualisations can be rearrange in the box below by dragging and droppping them)
Conversation Nesting

User Activity Analysis

Activity Analysis

Quick Overview

People & Issue Ring

Conversation Network

Social Network

Contribution Stream

Edgesense Social Network

Attention Map

Community Interest Network

Sub-Communities Network

Activity Bias

Rating Bias

Conversation Sunburst Network by Branch

Conversation Sunburst Network by Type

Conversation Treemap

Conversation Treemap By Type

Conversation Treemap - Top down

Conversation Treemap - Top down By Type

Contribution River

Collapsible Tree

Collapsible Tree by Posts

Choose the language for the embeddable:
Refresh every:
 |
 |
 |
 |
 |
 |
The above field is where you paste a url which must return jsonld
formatted to the Catalyst Interchange Format (CIF).
The system will then use this data to draw the visualisations you select.
Each visualisation has dependencies on the presence of certain data elements in the data you supply us.
Please check your data matches the dependencies for the visualisation you select.
Note: We cache your data temporarily to speed up displays and we therefore request
that you also indicate how often we should refresh our cached data from your given url in the next field.
The default is 60 seconds.
If you wish to override the terminology used in the visualisations for the node and link type names to make it more specific to your platform and users, you can supply a url that expresses their replacement names. You can find specific details on the structure of this json file on the Help page.

User Contributions
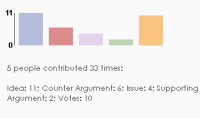
This mini visualisation displays a bar chart of contributins by node type and optinally votes.
Dependencies:
This requires nodes or posts with author data and optionally votes.
EmbedPage|PreviewDemo
User Viewing Activity
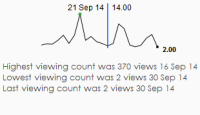
This mini visualisation displays a sparkline graph of user viewing statisitcs.
Dependencies:
This requires nodes or posts with author data and their viewing history.
EmbedPage|PreviewDemo
Participation Indicator
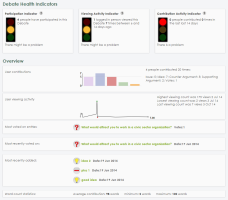
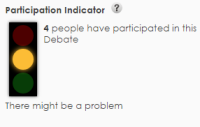
This mini visualisation displays a traffic light indicating participation health.
Dependencies:
This requires nodes or posts with author data.
EmbedPage|PreviewDemo
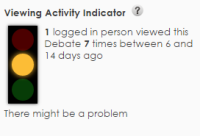
Viewing Activity Indicator
This mini visualisation displays a traffic light indicating Viewing activity health.
Dependencies:
This requires nodes or posts with author data and their viewing history.
EmbedPage|PreviewDemo
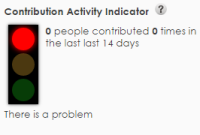
Contribution Activity Indicator
This mini visualisation displays a traffic light indicating contribution activity health.
Dependencies:
This requires nodes or posts with author and creation date data.
EmbedPage|PreviewDemo
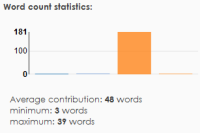
Word Counts
This mini visualisation displays word count statisitcs.
Dependencies:
This requires nodes or posts with author data
EmbedPage|PreviewDemo
Dashboard of Mini Visualisations
Below is an area to configure your dashboard embedable or link. You must choose the visualisations to include in your dashboard from the Mini Visualisations list above using the 'Use in Dashboard' checkboxes. These will then appear in the panel below.
NOTE: The CIF data you provde us in the visualisatoin data url above is used to draw all the dashboard visualisations you select, therefore it must contain all the dependent data required by each selected visualisation.
Dashboard (Once selected, visualisations can be rearrange in the box below by dragging and droppping them)
User Contributions

User Viewing Activity

Participation Indicator

Viewing Activity Indicator

Contribution Activity Indicator

Word Counts

 powered by Deliberatorium Analytics
Choose the language for the embeddable:
Refresh every:
 |
 |
 |
 |
 |
 |
The above field is where you paste a url which must return jsonld
formatted to the Catalyst Interchange Format (CIF).
The system will then use this data to process for alerts you select.
Note: We cache your data temporarily to speed up displays and we therefore request
that you also indicate how often we should refresh our cached data from your given url in the next field.
The default is 60 seconds.
If you wish to override the terminology used in the visualisations for the node and link type names to make it more specific to your platform and users, you can supply a url that expresses their replacement names. You can find specific details on the structure of this json file on the Help page.
If you wish to display user names, descriptions or homepage
links in any of the visualisations you select that require them,
but you do not wish that data to be cached or stored on a server,
you can optionally supply a separate url to get that data.
The user url is only called and displayed by the browser and
never the server, so that user data is not stored on any server.
The user data must be supplied in CIF format containing CIF Agent
objects with ids that match those supplied in the visualisation data given in the url above.
The user url must be https and the server processing the user url must be able to pick up
the 'callback' parameter we add to the their user url and wrap the reply json in the callback
function we name. Here is an example of a user url with a callback function appended:
https://debatehubdev.kmi.open.ac.uk/api/unobfuscatedusers/?id=1722128760457755001427202440&callback=processCIFUserDataMore help can be found on the User data and Privacy help page

Dependencies: These require minimally nodes or posts with author data. But ideally also connections, votes and views data.
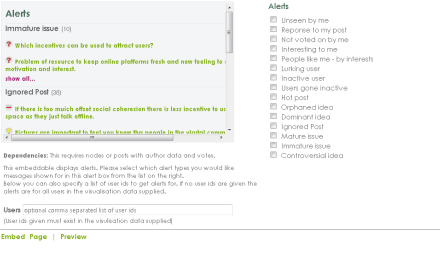
This embeddable displays alerts. Please select which alert types you would like messages shown for in this alert box from the list on the right.
Below you can also specify a list of user ids to get alerts for. If no user ids are given the alerts are for all users in the visualisation data supplied.(User ids given must exist in the visulisation data supplied)
Alerts
EmbedPage|Preview
About the CI Dashboard
The Collective Intelligence Dashboard (CI dashboard) is an open online service that provides analytics visualisations for online debate platforms. It is a place in which analytics on conversational and social dynamics can be made visible and fed back to the community for further awareness and reflection on the state and outcomes of an online debate. This site gives an overview of all analytics visualisations we provide, allows to view them individually with demo and own data, to assemble a custom dashboard of visualisations, and provides the information necessary to embed the visualisations or the custom dashboard into other online debate platforms.
CIDashboard uses your data passed to us in the Catalyst Interchange Format (CIF).
Research
The CI Dashboard comes from research on Contested Collective Intelligence carried out by the IDea group from the Knowledge Media Institute.
Contested Collective Intelligence (CCI) is a specific form of CI that emerges through structured discourse and argumentation. Mostly facilitated by argumentation-based online discussion tools, CCI aims at supporting collective sensemaking of complex societal dilemmas and seek to improve our collective capability to face complex problems by talking to each other and debating online.
One of the key issues shared by most common platforms for online debate is poor visualization. In fact, online debate is still heavily dominated by text-based content, while most online users nowadays wish to have access to easy-to-understand image/video-based content that they can grasp very rapidly and share easily with their peers. Even though, conveying results of online deliberation with effective visualization methods is an open challenge.
How would you visualize what happens in an online community?
How can we make idea and arguments more tangible so that they can be easily grasped, understood
and shared?
How do we device intuitive, engaging, interactive visualisations for users to better explore
and understand the main content, insights, outcomes and hidden dynamics of an online debate?
The CIDashboard Website is the result of research work aimed at answering those questions. It consists of a new service which supports debate summarization, understanding and sensemaking by providing a variety of alternative visualisations of the state, content and results of an online discussion.
Early user-requirements analysis of existing online community debating platforms revealed that there where the following main issues that we hoped to address:
- Participants struggle to get an overview of what happened in an online community debate. (Who are the key members? What are the most relevant discussions? Etc).
- Participants are rarely aware of other people's contributions before they contribute to the debate (this also leads to poorly informed contribution and idea duplication).
- Newcomers do not know where to start contributing.
- Community managers do not know where new contributions would be mostly needed (debate management is ineffective because community managers are missing tools to analyse the debate and direct users attention).
- Community managers struggle to summarise the state of a debate to disseminate results and engage new users.
These issues informed the choice of visualisations, analytics and alerts that you will find on this website. It is our aim to provide 'embeddables' that improve informed participation and the quality of contributions in an online debate site that uses them.
Tech Info
The Collective Intelligence dashboard (CI dashboard) is a analytics visualisation service provider for other online discussion and Collective Intelligence platform providers, such as for instance Assembl - a large scale co-production system, DebateHub - a hub for structured debates, or LiteMap - a debate mapping tool. The communication between the analytics visualisation provider and the platforms is based on a standardised data format - the CATALYST Interchange format Catalyst Interchange Format (CIF). The CIF format is modelled in terms of RDF and is serialised as JSON-LD. It provides a standardised description of online conversations. The CI dashboard uses the CIF data either directly to generate visualisations, or it requests CI statistics from the CATALYST metric service. This services calculates CI specific metrics from the CIF data and provides these to the CI dashboard.
For more info on the Catalyst Metric Service download the Deliberation Analytics Report.
Acknowledgments
CI Dashboard Design, Development and Testing was undertaken as part of the Catalyst Project by the Knowledge Media Institute team (Anna De Liddo and Michelle Bachler). We are also indebted to Harriett Cornish for graphic design.
- Movies
- Large Visualisations
- Mini Visualisations
- Alerts
- CIF
- Language Overriding
- User data and Privacy
Quick Intoduction(11m 55s)
Large Visualisations(11m 55s)
Mini Visualisations(11m 55s)
Alerts(11m 55s)
Embedding Large Visualisations
This help page will describe the large visualisation embed urls and their parameters and show some examples of use.
Individual Large Visualisations
An example of an iframe embed block for a single visualisation is:
<iframe src="https://cidashboard.net/ui/visualisations/circlepacking.php?width=1000&height=1000&withposts=false&lang=en&url=https%3A%2F%2Flitemap.net%2Fapi%2Fconversations%2F6d417f98-39b5-4d52-8759-90a297d7dd0e&userurl=&langurl=&timeout=60" width="1000" height="1000" style="overflow:auto" scrolling="auto" frameborder="1"></iframe>
An example of a url for a full page link for a single visualisation is:
https://cidashboard.net/ui/visualisations/circlepacking.php?width=1000&height=1000&withposts=false&lang=en&url=https%3A%2F%2Flitemap.net%2Fapi%2Fconversations%2F6d417f98-39b5-4d52-8759-90a297d7dd0e&userurl=&langurl=&timeout=60
You will notice that the src url for the iframe and the url for the full page link are basically the same. Though strictly speaking the full page link url does not require the width and height parameters, they are there because the url creation for both in centralised.
Below is a table describing the individual large visualisation. The URL base is the first part of biulding a url to call that individual visualisation:
| Title | Description | ID | URL base | Uses withposts |
| Conversation Network | This visualisation display a network graph of the connected posts in the Conversation | 1 | https://cidashboard.net/ui/visualisations/fdgraph.php? | true |
| Social Network | This visualisation display a social graph based on a given network graph. | 2 | https://cidashboard.net/ui/visualisations/socialgraph.php? | true |
| People & Issue Ring | This visualisation show people and issues, letting you explore who added what kinds if items to which issues. | 3 | https://cidashboard.net/ui/visualisations/sunburst.php? | false |
| Contribution River | This visualisations shows item creation over time for the various item types. | 4 | https://cidashboard.net/ui/visualisations/stackedarea.php? | true |
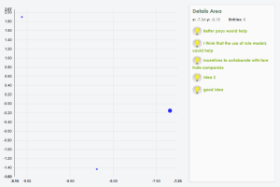
| Activity Bias | This visualisation clusters contributions based on similar activity patterns. | 5 | https://cidashboard.net/ui/visualisations/topicspace.php? | false |
| Rating Bias | This visualisation clusters contributions based on similar voting patterns. | 6 | https://cidashboard.net/ui/visualisations/biasspace.php? | false |
| Conversation Nesting | This visualisation shows a Conversation nested inside circles. The colours denote the node types. | 7 | https://cidashboard.net/ui/visualisations/circlepacking.php? | true |
| Activity Analysis | This visualisation shows the activity of a Conversation over time. | 8 | https://cidashboard.net/ui/visualisations/activityanalysis.php? | true |
| User Activity Analysis | This visualisation shows creation and voting activity by participant. | 9 | https://cidashboard.net/ui/visualisations/useractivityanalysis.php? | true |
| Contribution Stream | This visualisations shows item creation over time for the various item types. | 10 | https://cidashboard.net/ui/visualisations/streamgraph.php? | true |
| Quick Overview | This visualisations provides an overview of important aspects of a Conversation. | 11 | https://cidashboard.net/ui/visualisations/overview.php? | false |
| Attention Map | This visualisation shows a Conversation nested inside circles with colors denoting attention distribution across the contributions. | 12 | https://cidashboard.net/ui/visualisations/circlepackingattention.php? | false |
| Edgesense Social Network | This visualisation shows a social network based on the conversation data supplied. | 13 | https://cidashboard.net/ui/visualisations/edgesensehistory.php? | false |
| Community Interest Network | This visualisation display a network graph of the connected nodes in the Conversation showing the community interest in that node by ball size and colour changes. | 14 | https://cidashboard.net/ui/visualisations/fdinterestgraph.php? | true |
| Sub-Communities Network | This visualisation display a network graph of the connected nodes in the Conversation. It shows sub-community clustering within the Conversation where the shapes representing the nodes change shape and colour depending on their sub-community. | 15 | https://cidashboard.net/ui/visualisations/fdcommunitiesgraph.php? | true |
| Conversation Sunburst Network by Branch | This visualisation display a network graph of the connected nodes in the Conversation as a layered sunburst coloured by branch of the Conversation. | 16 | https://cidashboard.net/ui/visualisations/sunburstnetworkbranch.php? | true |
| Conversation Sunburst Network by Type | This visualisation display a network graph of the connected nodes in the Conversation as a layered sunburst coloured by node type. | 17 | https://cidashboard.net/ui/visualisations/sunburstnetwork.php? | true |
| Conversation Treemap | This visualisation displays a treemap of the Conversation. The colours of the squares change to represent sibling groupings. This version of the treemap is good for shallower trees. | 18 | https://cidashboard.net/ui/visualisations/treemap.php? | true |
| Conversation Treemap By Type | This visualisation displays a treemap of the Conversation. The colours of the squares change to represent node types.. This version of the treemap is good for shallower trees. | 19 | https://cidashboard.net/ui/visualisations/treemapbytype.php? | true |
| Conversation Treemap - Top down | This visualisation displays a treemap of the Conversation. The first two levels of the tree are exposed initially and then you drill down by clicking the labelled boxes. This version of the treemap is good for deeper trees. | 20 | https://cidashboard.net/ui/visualisations/treemaptopdown.php? | true |
| Conversation Treemap - Top down By Type | This visualisation displays a treemap of the Conversation. The first two levels of the tree are exposed initially and then you drill down by clicking the labelled boxes. The box colour indicate the node type. This version of the treemap is good for deeper trees. | 21 | https://cidashboard.net/ui/visualisations/treemaptopdownbytype.php? | true |
| Collapsible Tree | This visualisation displays a tree of the Conversation. The node circle and link sizes are determined by the number of children below a given node. | 22 | https://cidashboard.net/ui/visualisations/treezoom.php? | true |
| Collapsible Tree by Posts | This visualisation displays a tree of the Conversation. The node and link sizes are determined by the number of posts below a given node. | 23 | https://cidashboard.net/ui/visualisations/treezoomposts.php? | false |
Below is a table describing the url parameters that you can use with the URL base strings given above.:
| Parameter | Default / Use | Further Info |
| url | (compulsory) Must return CIF formatted jsonld | CIF help page |
| userurl | (optional) Must be a https url returning CIF formatted jsonld wrapped in our callback function | User and Privacy help page |
| langurl | (optional) Must return correctly formatted json | Language Overriding help page |
| timeout | (optional - default is 60) Number of seconds to cache the visualisation CIF data for on our server. | |
| withposts | (optional - default is false) true/false; Only used with some individual visualisatoins (see above table), NOT dashboards. Indicates whether to include post data if present in the visualisation | |
| withtitle | (optional - default is true) true/false; indicates whether to display our title above the visualisation. When used on a dashboard url, this applies to all visualisations | |
| withdesc | (optional - default is true) true/false; indicates whether to display our description above the visualisation. When used on a dashboard url, this applies to all visualisations | |
| width | (optional - default 1000) Only used on iframe src url. Please include this if you make a change to the default iframe width property we set | |
| height | (optional - default 1000) Only used on iframe src url. Please include this if you make a change to the default iframe height property we set |
Example iframe of a single large visualisation:
Dashboard of Large Visualisations
An example of an iframe embed block for a dashboard of large visualisations is:
<iframe src="https://cidashboard.net/ui/visualisations/index.php?width=1000&height=1000&vis=p7%2C8%2Cp1%2C16%2C21%2C23&lang=en&title=Test%20Dashboard%20of%20Large%20Visualisations&url=https%3A%2F%2Flitemap.net%2Fapi%2Fconversations%2F6d417f98-39b5-4d52-8759-90a297d7dd0e&userurl=&langurl=&timeout=60" width="1000" height="1000" style="overflow:auto" scrolling="auto" frameborder="1"></iframe>
An example of a url for a full page link for a dashboard of large visualisations is:
https://cidashboard.net/ui/visualisations/index.php?width=1000&height=1000&vis=p7%2C8%2Cp1%2C16%2C21%2C23&lang=en&title=Test%20Dashboard%20of%20Large%20Visualisations&url=https%3A%2F%2Flitemap.net%2Fapi%2Fconversations%2F6d417f98-39b5-4d52-8759-90a297d7dd0e&userurl=&langurl=&timeout=60
You will notice that again the src url for the iframe and the url for the full page link are basically the same. However, unlike when embedding individual visualisations, with dashboards the page called is always https://cidashboard.net/ui/visualisations/index.php?, but it has some additional parameters as given below:
| Parameter | Default / Use |
| vis | (compulsory) This string indicates which visualisations you have selected for your dashboard as well as the order they are to be displayed. It is a comma separate string of the large visualisation ID numbers, as given in the Large Visualisations table above. Some of the visualisation ID numbers can have a letter after them. The letter p before an ID number denotes you wish to include posts (withposts) for that visualisation (see the Large visualisation table above for which visualisations this applies to). For the Edgesense visualisation you can also have c before its ID number to denote you want the network only. |
| title | (optional) Title - a title for your dashboard. |
Example iframe of a dashboard of large visualisations:
Embedding Mini Visualisations
This help page will describe the mini visualisation embed urls and their parameters and show some examples of use.
Individual Mini Visualisations
An example of an iframe embed block for a single visualisation is:
<iframe src="https://cidashboard.net/ui/minis/usercontributions.php?miniwithposts=false&lang=en&url=https%3A%2F%2Flitemap.net%2Fapi%2Fviews%2Fb6f0374d-da86-4b13-9fc7-a16f154a5ff0&langurl=&timeout=60" width="350" height="220" frameborder="0"></iframe>
An example of a url for a full page link for a single visualisation is:
https://cidashboard.net/ui/minis/usercontributions.php?miniwithposts=false&lang=en&url=https%3A%2F%2Flitemap.net%2Fapi%2Fviews%2Fb6f0374d-da86-4b13-9fc7-a16f154a5ff0&langurl=&timeout=60
You will notice that the src url for the iframe and the url for the full page link are basically the same.
Below is a table describing the individual mini visualisation. The URL base is the first part of biulding a url to call that individual visualisation:
| Title | Description | ID | URL base | Uses withposts |
| User Contributions | This mini visualisation displays a bar chart of contributins by node type and optinally votes. | 1 | https://cidashboard.net/ui/minis/usercontributions.php? | true |
| User Viewing Activity | This mini visualisation displays a sparkline graph of user viewing statisitcs. | 2 | https://cidashboard.net/ui/minis/userviewing.php? | true |
| Participation Indicator | This mini visualisation displays a traffic light indicating participation health. | 3 | https://cidashboard.net/ui/minis/healthparticipation.php? | true |
| Viewing Activity Indicator | This mini visualisation displays a traffic light indicating Viewing activity health. | 4 | https://cidashboard.net/ui/minis/healthviewing.php? | true |
| Contribution Activity Indicator | This mini visualisation displays a traffic light indicating contribution activity health. | 5 | https://cidashboard.net/ui/minis/healthcontributions.php? | true |
| Word Counts | This mini visualisation displays word count statisitcs. | 6 | https://cidashboard.net/ui/minis/wordstats.php? | true |
Below is a table describing the url parameters that you can use with the URL base strings given above.:
| Parameter | Default / Use | Further Info |
| url | (compulsory) Must return CIF formatted jsonld | CIF help page |
| langurl | (optional) Must return correctly formatted json | Language Overriding help page |
| timeout | (optional - default is 60) Number of seconds to cache the visualisation CIF data for on our server. | |
| miniwithposts | (optional - default is false) true/false; Only used with some individual visualisatoins (see above table), NOT dashboards. Indicates whether to include post data if present in the visualisation |
Example iframe of a single mini visualisation:
Dashboard of Mini Visualisations
An example of an iframe embed block for a dashboard of mini visualisations is:
<iframe src="https://cidashboard.net/ui/minis/minidashboard.php?vis=1%2Cp3%2C6&lang=en&title=Test%20Dashboard%20of%20Mini%20Visualisations&url=https%3A%2F%2Flitemap.net%2Fapi%2Fviews%2Fb6f0374d-da86-4b13-9fc7-a16f154a5ff0&langurl=&timeout=60" width="1000" height="400" style="overflow:auto" scrolling="auto" frameborder="1"></iframe>
An example of a url for a full page link for a dashboard of large visualisations is:
https://cidashboard.net/ui/minis/minidashboard.php?vis=1%2Cp3%2C6&lang=en&title=Test%20Dashboard%20of%20Mini%20Visualisations&url=https%3A%2F%2Flitemap.net%2Fapi%2Fviews%2Fb6f0374d-da86-4b13-9fc7-a16f154a5ff0&langurl=&timeout=60
You will notice that again the src url for the iframe and the url for the full page link are basically the same. However, unlike when embedding individual visualisations, with dashboards the page called is always https://cidashboard.net/ui/minis/minidashboard.php?, but it has some additional parameters as given below:
| Parameter | Default / Use |
| vis | (compulsory) This string indicates which visualisations you have selected for your dashboard as well as the order they are to be displayed. It is a comma separate string of the large visualisation ID numbers, as given in the Large Visualisations table above. Some of the visualisation ID numbers can have a letter after them. The letter p before an ID number denotes you wish to include posts (withposts) for that visualisation). |
| title | (optional) Title - a title for your dashboard. |
Example iframe of a dashboard of mini visualisations:
This help page will describe the alerts, alert embed urls and their parameters. All the alerts are
powered by Deliberatorium Analytics

Below is a table describing the individual Alerts and their dependencies:
| Title | Description | ID | Metric ID | Data Dependencies |
| Unseen by me | I have not seen this post yet. | 1 | unseen_by_me | This alert requires nodes, users and view events |
| Reponse to my post | This post is a response to a post I authored. | 2 | response_to_me | This alert requires nodes, connections and users |
| Not voted on by me | I have not yet voted on this post. | 3 | unrated_by_me | This alert requires nodes, users and votes |
| Interesting to me | Find posts that should interest a user, given their previous interests. This alert estimates the user's interests in each post based on how much attention he/she gave it or it's nearest neighbors in the past. It then identifies the posts whose "interest" scores are in the top 50%. | 4 | interesting_to_me | This alert requires users and their activity history |
| Viewed by similar people to me | This post was viewed by people with similar interests to me (based on SVD analysis of activity patterns). | 5 | interesting_to_people_like_me | This alert requires nodes, users and view events |
| Hot post | This post has received a lot of interest in general. | 7 | hot_post | This alert requires users and their activity history |
| Orphaned idea | This idea post is receiving much less attention than its siblings. | 8 | orphaned_idea | This alert requires nodes, connections, users and their activity |
| Dominant idea | One idea has predominance of community support (for a given issue). | 9 | winning_idea | This alert requires nodes, connections, users and votes |
| People like me - by interests | People who have similar interests to me, based on activity patterns. | 12 | person_with_interests_like_mine | This alert requires users and their activity history |
| Ignored Post | Post has not been seen by anyone but original author | 14 | ignored_post | This alert requires nodes, their authors and view events |
| Lurking user | User has not edited or created any posts | 15 | lurking_user | This alert requires users and create and edit events |
| Inactive user | Finds users who have done zilch | 16 | inactive_user | This alert requires users and their activity history |
| Mature issue | Issue has >= 3 ideas with at least one argument each | 17 | mature_issue | This alert requires nodes, connections |
| Immature issue | Issue has < 3 ideas with no arguments | 18 | immature_issue | This alert requires nodes, connections |
| Users gone inactive | Users who were initially active, but stopped | 19 | user_gone_inactive | This alert requires users, their activity history |
| Controversial idea | The community has widely divergent opinions (as reflected by their voting) of whether an idea is a good one or not. | 20 | controversial_idea | This alert requires nodes, connections and votes |
| Rating ignored argument | Identifies relevant arguments that the user did not view before rating a post | 23 | rating_ignored_argument | This alert requires nodes, connections, votes and view events |
| Unseen response | Identifies unseen (by me) responses authored by someone else to a post I authored | 24 | unseen_response | This alert requires nodes, connections, create and view events |
| Unseen competitor | Identifies ideas from someone else that competes with an idea I authored | 25 | unseen_competitor | This alert requires nodes, connections, create and view events |
| User ignored competitors | Identifies users who ignored competitors to their ideas. For each user, it lists the issues the user offered ideas for, followed by the competing ideas that the user ignored (i.e. did not view or respond to). | 26 | user_ignored_competitors | This alert requires nodes, connections, create and view events |
| User ignored arguments | Identifies users who ignored underlying arguments when rating posts. For each user, it lists the rated posts followed by the arguments for each of those posts that the user ignored (i.e. did not view or respond to). | 27 | user_ignored_arguments | This alert requires nodes, connections, votes, create and view events |
| User ignored responses | Identifies users who ignored responses by other people to their posts. For each user, it lists the user-authored posts followed responses to each of those posts that the user ignored (i.e. did not view or respond to). | 28 | user_ignored_responses | This alert requires nodes, connections, create and view events |
An example of an iframe embed block for a set of alerts is:
<iframe src="https://cidashboard.net/ui/minis/alerts.php? userids=&lang=en&url=https%3A%2F%2Flitemap.net%2Fapi%2Fviews%2Fb6f0374d-da86-4b13-9fc7-a16f154a5ff0&userurl=&langurl=&timeout=60&alerts=24%2C25%2C15%2C16%2C19%2C7%2C8%2C9%2C14%2C17%2C18%2C20%2C23" width="500" height="300" style="overflow:auto" scrolling="auto" frameborder="0"></iframe>
An example of a url for a full page link for a set of alerts is:
https://cidashboard.net/ui/minis/alerts.php?userids=false&lang=en&url=https%3A%2F%2Flitemap.net%2Fapi%2Fviews%2Fb6f0374d-da86-4b13-9fc7-a16f154a5ff0&userurl=&langurl=&timeout=60&alerts=24%2C25%2C15%2C16%2C19%2C7%2C8%2C9%2C14%2C17%2C18%2C20%2C23
You will notice that the src url for the iframe and the url for the full page link are basically the same.
Below is a table describing the url parameters that you can use with the URL base:
https://cidashboard.net/ui/minis/alerts.php?
| Parameter | Default / Use | Further Info |
| url | (compulsory) Must return CIF formatted jsonld | CIF help page |
| userurl | (optional) Must be a https url returning CIF formatted jsonld wrapped in our callback function | User and Privacy help page |
| langurl | (optional) Must return correctly formatted json | Language Overriding help page |
| timeout | (optional - default is 60) Number of seconds to cache the visualisation CIF data for on our server. | |
| userids | (optional) This string indicates which users you want to generate alerts for. It is a comma separated list of the user ids as found in the Visualisation data supplied in the url parameter. | |
| alerts | (compulsory) This string indicates which alerts you have selected. It is a comma separate string of the large alerts ID numbers, as given in the alerts table above. |
Example iframe of a list of alerts:
The Catalyst Interchange Format (CIF) is a jsonld schema for representing conversational data from online forums, debating tools and dialogue mapping websites.
There are two key documents for understanding the Catalyst Interchange Format (CIF):
Below are some key concepts extracted from the interoperability specification:
Most Collective Intelligence tools allow organising concepts in some sort of structure that reflects the conversation back to the participants (a concept map in the very broadest sense). The core of this specification is a Data Model to represent the following in a systems-independent way while preserving as much semantics as practical:"
- The generic ideas of the concept map
- The people interacting with them
- The interactions these people have about the generic ideas (Messages, comments, votes, etc.)
It goes on to say:
The type and amount of structure can vary greatly between systems, but we believe there are some useful levels of "shared semantics" that are achievable relatively easily. The first and most basic level is sharing the raw structure of the concept map (nodes, edges) with very basic information (such as node title). This allows several visualisation tools to be applied, as well as a significant number of metrics. The second level is to share more semantics about the nature of the concepts identified. The consortium agreed that using IBIS (Issue-Based Information System) as a common baseline would foster the emergence of initial tooling. While it has significant limitations, IBIS is a good choice because:
- It's widely used by existing Collective Intelligence software
- Many systems not using IBIS could transform at least a subset of their data into meaningful IBIS
So, to leverage the visualisations and analytics we provide, the more detailed CIf you can provide us the better the results you will get. But even with very simple forum post trees there are many visualisations and alerts you can access.
The following terms can be overridden in the visualisation interfaces by providing a url to a json file containing the overrides which you place in the 'Language override' field. You can override all or only some of the terms.
Node label overrides & Bits
| Term Name | Cif Term / Explanation | Default Singular | Default Plural |
| CHALLENGE_NAME | Question | Challenge | Challenges |
| ISSUE_NAME | Issue | Issue | Issues |
| SOLUTION_NAME | Position | Idea | Ideas |
| ARGUMENT_NAME | Argument | Argument | Arguments |
| PRO_NAME | When Argument has only supporting links | Supporting Argument | Supporting Arguments |
| CON_NAME | When Argument has only opposing links | Counter Argument | Counter Arguments |
| RESOURCE_NAME | Reference | Url | Urls |
| IDEA_NAME | GenericIdea & GenericIdeaNode | Note | Notes |
| COMMENT_NAME | SPost | Comments | Comments |
| MAP_NAME | Map | Map | Maps |
| DECISION_NAME | Decision | Decision | Decisions |
| DEBATE_NAME | Term used for a discussion/conversation/debate/dialogue | Conversation | Conversations |
| GROUP_NAME | Term used for top level grouping in some tree visualisations | Group | Groups |
Link label overrides
Link labels are currently only used on the 'Conversation Network' visualisation.
| Term Name | Cif Term / Explanation | Default Text |
| LINK_ISSUE_CHALLENGE | IssueQuestions | is related to |
| LINK_SOLUTION_ISSUE | PositionRespondsToIssue & InclusionRelation | responds to |
| LINK_ISSUE_SOLUTION | IssueAppliesTo | responds to |
| LINK_PRO_SOLUTION | ArgumentSupportsIdea | supports |
| LINK_CON_SOLUTION | ArgumentOpposesIdea | challenges |
| LINK_RESOURCE_NODE | Reference —> Node | is related to |
| LINK_IDEA_NODE | DirectedIdeaRelation | responds to |
| LINK_COMMENT_COMMENT | SPost —> SPost | responds to |
| LINK_COMMENT_NODE | SPost —> Idea | is related to |
| LINK_DECISION_ISSUE | Decision —> Issue | responds to |
Below is an example of the expected structure of the json file. Remember you don't need to include all the terms, only those that you want to override.
	[
		{
		"term": "CHALLENGE_NAME",
		"label": [
			{
				"language": "en",
				"singular": "Challenge",
				"plural": "Challenges"
			}
		]
		},
		{
		"term": "ISSUE_NAME",
		"label": [
			{
				"language": "en",
			"singular": "Issue",
			"plural": "Issues"
			}
		]
		},
		{
		"term": "SOLUTION_NAME",
		"label": [
			{
				"language": "en",
			"singular": "Idea",
			"plural": "Ideas"
			}
		]
		},
		{
		"term": "ARGUMENT_NAME",
		"label": [
			{
				"language": "en",
			"singular": "Argument",
			"plural": "Arguments"
			}
		]
		},
		{
		"term": "PRO_NAME",
		"label": [
			{
				"language": "en",
			"singular": "Supporting Argument",
			"plural": "Supporting Arguments"
			}
		]
		},
		{
		"term": "CON_NAME",
		"label": [
			{
				"language": "en",
			"singular": "Counter Argument",
			"plural": "Counter Arguments"
			}
		]
		},
		{
		"term": "RESOURCE_NAME",
		"label": [
			{
				"language": "en",
			"singular": "Url",
			"plural": "Urls"
			}
		]
		},
		{
		"term": "COMMENT_NAME",
		"label": [
			{
				"language": "en",
			"singular": "Comment",
			"plural": "Comments"
			}
		]
		},
		{
		"term": "IDEA_NAME",
		"label": [
			{
				"language": "en",
			"singular": "Note",
			"plural": "Notes"
			}
		]
		},
		{
		"term": "DECISION_NAME",
		"label": [
			{
				"language": "en",
			"singular": "Decision",
			"plural": "Decisions"
			}
		]
		},
		{
		"term": "MAP_NAME",
		"label": [
			{
				"language": "en",
			"singular": "Map",
			"plural": "Maps"
			}
		]
		},
		{
		"term": "DEBATE_NAME",
		"label": [
			{
				"language": "en",
			"singular": "Conversation",
			"plural": "Conversations"
			}
		]
		},
		{
		"term": "LINK_ISSUE_CHALLENGE",
		"label": [
			{
				"language": "en",
			"text": "is related to"
			}
		]
		},
		{
		"term": "LINK_SOLUTION_ISSUE",
		"label": [
			{
				"language": "en",
			"text": "responds to"
			}
		]
		},
		{
		"term": "LINK_ISSUE_SOLUTION",
		"label": [
			{
				"language": "en",
			"text": "responds to"
			}
		]
		},
		{
		"term": "LINK_PRO_SOLUTION",
		"label": [
			{
				"language": "en",
			"text": "supports"
			}
		]
		},
		{
		"term": "LINK_CON_SOLUTION",
		"label": [
			{
				"language": "en",
			"text": "challenges"
			}
		]
		},
		{
		"term": "LINK_RESOURCE_NODE",
		"label": [
			{
				"language": "en",
			"text": "is related to"
			}
		]
		},
		{
		"term": "LINK_COMMENT_NODE",
		"label": [
			{
				"language": "en",
			"text": "is related to"
			}
		]
		},
		{
		"term": "LINK_COMMENT_COMMENT",
		"label": [
			{
				"language": "en",
			"text": "responds to"
			}
		]
		},
		{
		"term": "LINK_IDEA_NODE",
		"label": [
			{
				"language": "en",
			"text": "responds to"
			}
		]
		},
		{
		"term": "LINK_DECISION_ISSUE",
		"label": [
			{
				"language": "en",
			"text": "responds to"
			}
		]
		}
	]
If you wish to display user names, descriptions or homepage links in any of the visualisations you select that require them, but you do not wish that data to be cached or stored on a server, you can optionally supply a separate url to get that data. The user url is only called and displayed by the browser and never the server, so that user data is not stored on any server.
The user data must be supplied in Catalyst Interchange Format (CIF) containing CIF Agent objects with Agent "@id" parameters that match those supplied in the visualisation CIF data you give us.
The user url must be https and the server processing the user url must be able to pick up the 'callback' parameter we add to the their user url and wrap the reply json in the callback function we name. Here is an example of a user url with a callback function appended:
https://debatehubdev.kmi.open.ac.uk/api/unobfuscatedusers/?id=1722128760457755001427202440&callback=processCIFUserData
So, as an example, in the visualisation CIF data you would give us the user Agent entries with just the id parameters completed but no personal information, e.g.:
        ...
        {
            "@type": "Agent",
            "@id": "main_site:agents/3PAgpYJCTXJV8fpjRnROsPzJrNwqdJAwewPULnZq1Q%3D%3D"
        },
        {
            "@type": "Agent",
            "@id": "main_site:agents/3PaHB97mVdmSWSYa9HmRtfLhXnuereJgD3jTOmJZ"
        },
        {
            "@type": "Agent",
            "@id": "main_site:agents/3PaHB97mVdhama%2BhPIJif%2BO0K0sF"
        },
        {
            "@type": "Agent",
            "@id": "main_site:agents/1YqwWAXoGpx99g4isKTxKHptqYYKREr3qCVLpw%3D%3D"
        },
        ...
Then when we called your user data url from the browser you would give us just the Agent entries again but this time with any user information like "fname" etc.. filled in. Remembering that the "@id" parameters must match those you supplied us in the visualisation data, e.g.:
        {
            "@context": [
                "http://purl.org/catalyst/jsonld",
                {
                    "main_site": "http://debatehubdev.kmi.open.ac.uk/api/"
                }
            ],
            "@graph": [
                {
                    "@type": "Agent",
                    "@id": "main_site:agents/3PAgpYJCTXJV8fpjRnROsPzJrNwqdJAwewPULnZq1Q%3D%3D",
                    "img": "url to user image",
                    "fname": "Lee-Sean Huang"
                },
                {
                    "@type": "Agent",
                    "@id": "main_site:agents/3PaHB97mVdmSWSYa9HmRtfLhXnuereJgD3jTOmJZ",
                    "img": "url to user image",
                    "fname": "Anna De Liddo"
                },
                {
                    "@type": "Agent",
                    "@id": "main_site:agents/3PaHB97mVdhama%2BhPIJif%2BO0K0sF",
                    "description": "CIDashboard software developer",
                    "img": "url to user image",
                    "homepage": "http://kmi.open.ac.uk/people/bachler/",
                    "fname": "Michelle Bachler - Yahoo"
                },
                {
                    "@type": "Agent",
                    "@id": "main_site:agents/1YqwWAXoGpx99g4isKTxKHptqYYKREr3qCVLpw%3D%3D",
                    "img": "url to user image",
                    "fname": "Thomas Ullmann"
                },
            ]
        }
